Welcome to Jain Irrigation Systems Ltd.
Blog at Jains
Blog at Jains - Soil-Plant-Water Relationship in Drip Irrigation System
Soil water relationship
The soil is a storehouse of plant nutrients, and the medium through which water and nutrients move. It is the anchorage for plants and the reservoir of water for plant growth. The characteristics of soils vary widely according to their physical properties, often determining the type of crop which can be grown, and also the nature of irrigation system which is appropriate. Therefore, a thorough understanding of soil properties is important for purposes of irrigation design.
Soil texture refers to the relative proportion of the various sizes of soil particles (sands, silts and clays) making up the soil. Soil texture is determined by first passing a sample of soil through a two millimeter mesh screen to remove any organic matter. The sample is then carefully graded by particle size to determine the percentages of sand, silt and clay present. Soil texture plays a major role in the processes which govern water movement, water holding capacity, and the availability and retention of nutrients.
Separation of the sand, silt, and clay may be accomplished by thoroughly shaking a soil sample in a tall cylinder of water and allowing the various sizes to settle. The sand will settle to the bottom in a minute or less. ; the silt will settle in 2 to 3 hours; clay will settle on top of the silt layer in 18 to 24 hours; colloidal clay sizes may remain in suspension indefinitely. A simple comparison of the volume occupied by each of the soil separates with the known volume of the original sample will give a fairly accurate percentage of each. Soil is made up of particles of different sizes and shapes. In most soils the particles are tied to each other in large units called aggregates and clods.
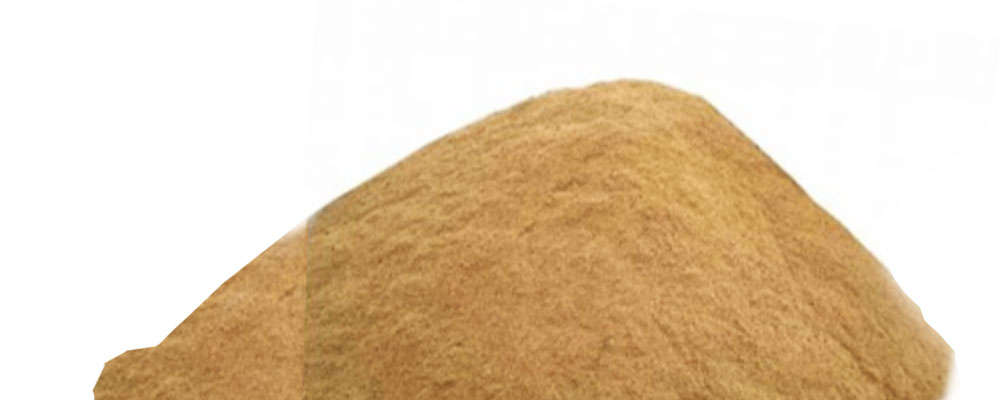
Photo 1.Sand
Particle size 2-4.75 mm Coarse sand (builder sand); 0.425 – 2 mm Medium sand ; 0.075-0.425
mm fine sand. Sand particles are a wide range of sizes (0.075 mm to 4.75 mm).
Large pores, improves aeration and drainage.
mm fine sand. Sand particles are a wide range of sizes (0.075 mm to 4.75 mm).
Large pores, improves aeration and drainage.
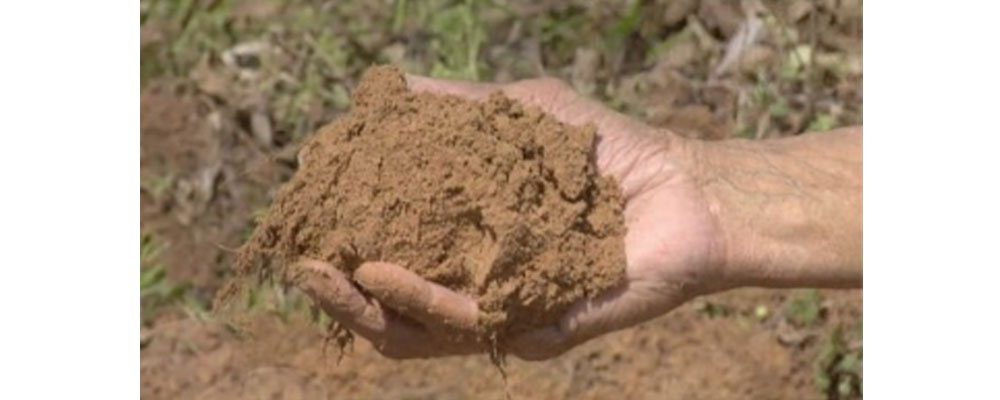
Photo 2.Silt
Particle size 0.002 -0.06 mm. Intermediate particle size compared to sand and clay. Smaller
pores but more in number per unit volume; lesser drainage compared to sand and more
compared to clay.
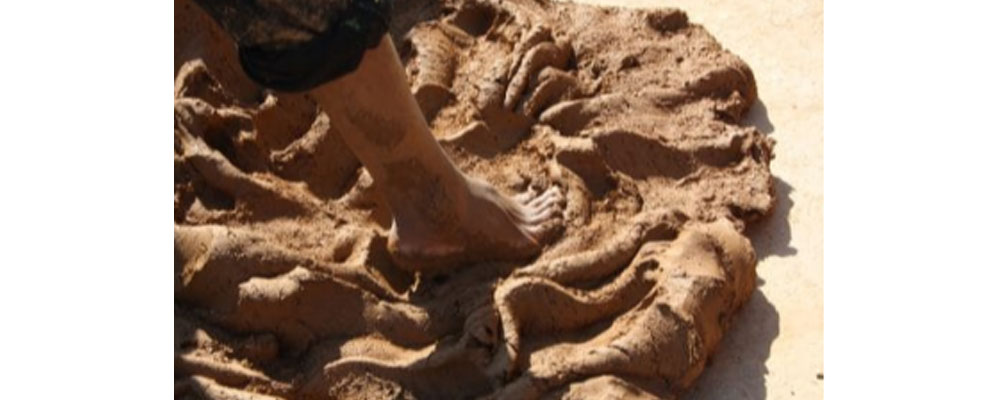
Photo 3.Clay
Clay particles are smallest of the lot, less than 0.002 mm. It consists of microscopic particles and
smallest pores practically disallowing drainage. The particles can stick together to form a gluey
structure when wet.
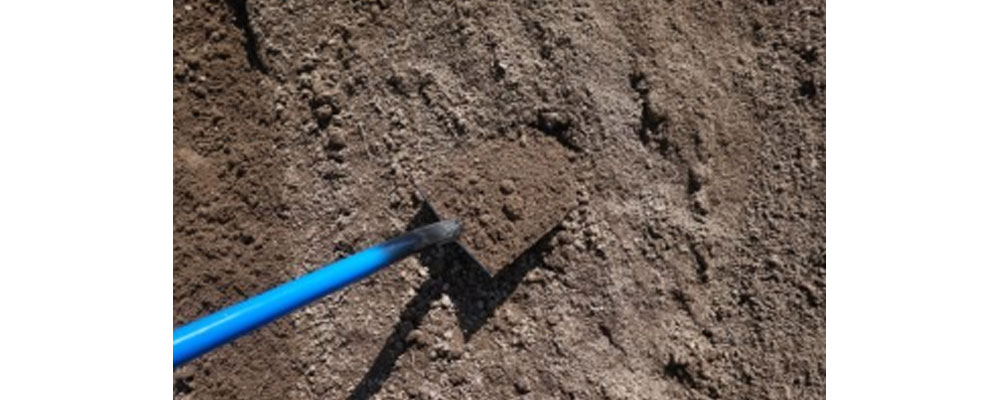
Photo 4.Loam soil.
Loam is a mixture of all the three mentioned above- sand, silt and clay. Based on which of the three is highest in the mix, the soil gets its textural names- sandy loam, silty loam and clay loam illustrating the dominant proportion of the component in it. Similarly, loam also has a mix of the properties of these three components proportional to the fraction (%) of each.
A soil mass is a three phase system consisting of solid particles called soil grains, water and air. The space between the soil grain is filled partially with water and partially with air.
The soil is also considered as a store house of plant nutrients and the medium for the plant to grow and through which water and nutrients move. It is the anchorage for plants and the reservoir of water for plants growth.
The soil texture refers to the relative proportion of the various sizes of mineral, particles (sand, silts and clays) making of the soil.
Table 1. Principal textural groups proposed by US bureau of soils
| Sr.No. | Textural Group | Sand Per Cent | Silt Per Cent | Clay Per Cent |
| Sand | 80-100 | 0-20 | 0-20 | |
| Sandy loam | 50-80 | 0-50 | 0-20 | |
| Loam | 30-50 | 30-50 | 0-20 | |
| Silt loam | 0-50 | 50-100 | 0-20 | |
| Sandy clay loam | 50-80 | 0-30 | 20-30 | |
| Silty clay loam | 0-30 | 50-80 | 20-30 | |
| Clay loam | 20-50 | 20-50 | 20-30 | |
| Sandy clay | 50-70 | 0-20 | 30-50 | |
| Silty clay | 0-20 | 50-70 | 30-50 | |
| Clay | 0-50 | 0-50 | 30-110 |
Structure refers to the aggregates in which soil particles are arranged such as single grained, granular, platy and blocky denotes various type of soils structure. Soils structures influences moisture relationship, water movement, availability of nutrients, microbial activity, root development and plant growth.
Tilth refers to the physical condition of the soil in relation to plant growth. Soils in good condition are mellow, crumbly, easily worked, and take water readily. Soils in poor tilth are hard, cloddy, and difficult to work, take up water slowly, have poor drainage.
Wetted Pattern in the Soil
When water is applied slowly to the soil at a single point, it is acted upon by the forces of gravity (downwards) and capillarity (radially outwards), producing a spread pattern characteristic of the soil type and water application rate.
Fig 1. Moisture distribution (wetting pattern) form point emission source in clay, loam and sandy texture soils.
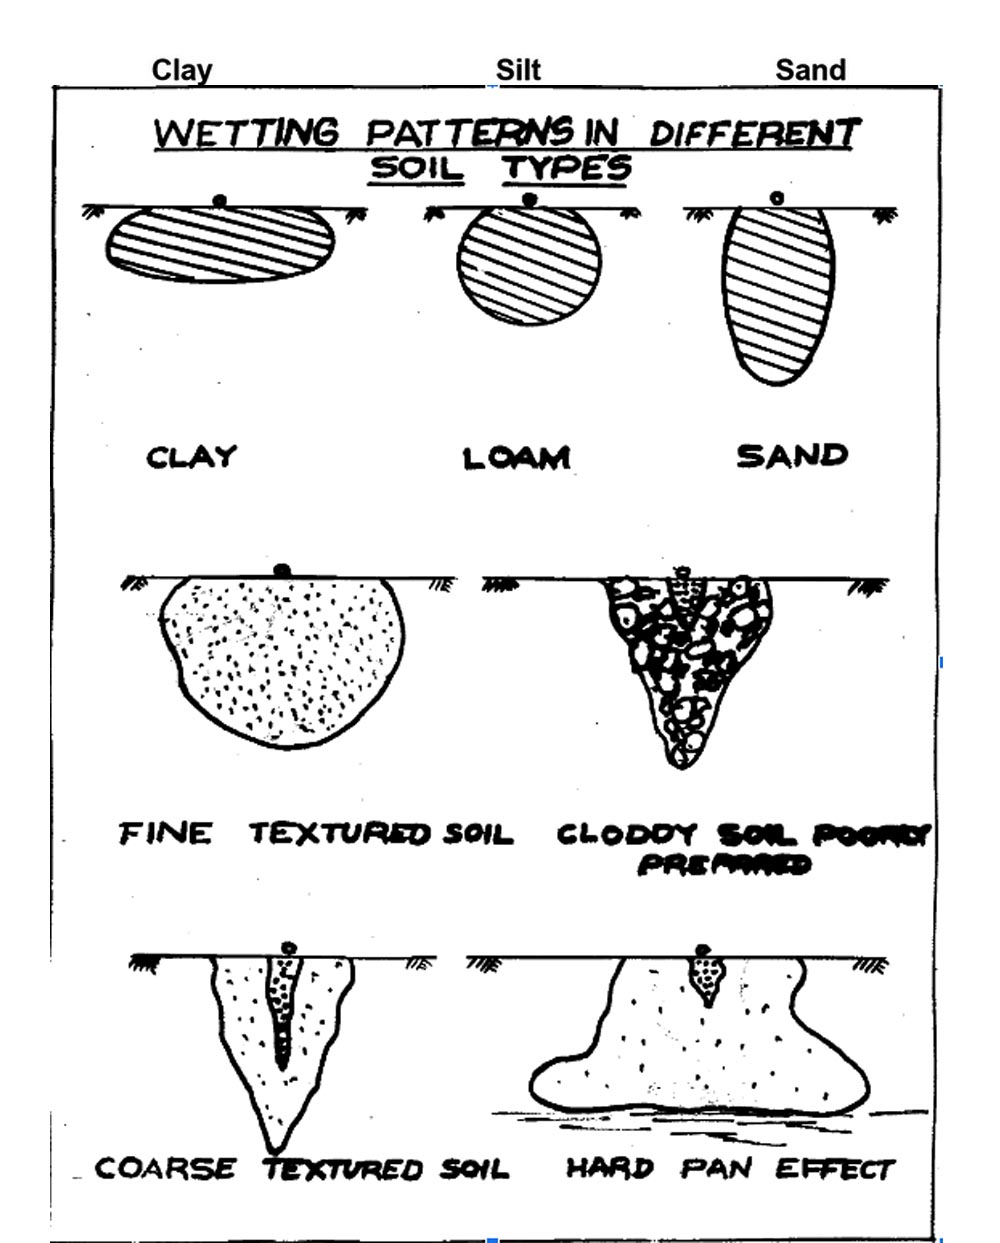
Sandy soils are characterized by large voids (pores) between soil particles. These large voids exert relatively weak capillary forces, but offer little resistance to gravitational flow, with the result that lateral and upward water movement is limited, while downward water movement is rapid.
Spacing of lateral and emitter in sandy soils
The wetting pattern for a sandy soil will therefore be deep with little lateral spread, and upward water movement will be minimal (Fig 1). In such soil we should use drip lines at closer spacing (50 or 60 cm) and dripper to dripper spacing 30 or 40 cm. The experience from the field show that the radius of wetting front can only be 12-15 cm. So a 30 cm spacing will give a spread radius of 15 cm and the wetting front of two adjacent drippers will join (coalesce) and we achieve strip wetting without any break. Please note an hour emission by a 2.4 lph dripper is considered here. One may also note by increasing emission duration will not increase the spread radius much (field experience and information from modelling studies). Increasing emission duration to more than 2 hours will only result in water draining vertically down to soil layers below the root zone.
Spacing of lateral and emitter in clay soils
At the other extreme, a heavy clay soil exerts strong capillary forces, but resists downward water movement by gravity. The wetted pattern in a heavy clay soil will tend to be broad and of moderate depth because of the clay’s high capillary forces and relatively low permeability (Fig 1). In clay soils which have undergone compaction, the downward movement of the water is even further restricted, resulting in a wetter zone that is wide and shallow (as shown in photo 2). Thus, in clay soils the wetted pattern will depend not only on soil type, but will also vary markedly with the tilth of the soil.
The radius of wetting front can reach up to 38 to 45 cm based on the clay content (%) in the top soil. The lateral to lateral spacing can be 90 cm to 1.2 m based on the clay %. Crop rows can be spaced in such a way that the rows are within the wetting area of nearest two drip lines leaving the middle part that may remain dry.
Dripper to dripper spacing can be 60 or 75 cm. Because the gravitational pull on the wetting front is relatively low, high discharge drippers will flood the soil surface. Logically the rate of emission should be equal to the rate of water movement into the soil (infiltration rate) so that there will not be surface run off and flooding.
For the majority of soils, wetting pattern will be between the extremes exhibited by light sands and heavy clays. In addition, water movement in soils will be affected by the condition of the topsoil, the permeability of the subsoil, layers of soil with varying properties, and the presence of a plow pan. Following figure illustrate the relative shapes of wetting pattern which might be created under an emitter in various soil types.
Table 2. Wetting pattern (radius and depth) in a silty soil of 3 different
emitters of different rates of emission and different emitter spacing on the
lateral. #
| Sr.No. | Parameter | Values with drippers of different discharges in Silty Soil (particle size between sand and clay) | ||
| 1 lph dripper | 2 lph dripper | 4 lph dripper | ||
| 1 | Emitter Spacing, cm | 30 | 40 | 75 |
| 2 | Emitter Discharge, lph | 1 | 2 | 4 |
| 3 | Row to Row Spacing, m | 0.91 | 0.91 | 0.91 |
| 4 | Lateral to Lateral Spacing, m |
1.83 | 1.83 | 1.83 |
| 5 | Lateral in 1ha, m | 5467 | 5467 | 5467 |
| 6 | No of drippers in 1 ha, nos | 18222 | 27333 | 29156 |
| 7 | Discharge per ha, lph | 18222 | 27333 | 29156 |
| 8 | Irrigation depth, mm/day | 6 | 6 | 6 |
| 9 | Irrigation duration, hours | 3.29 | 2.20 | 2.06 |
| 10 | Wetted Radius on soil surface at the end of the irrigation duration, m |
0.18 | 0.19 | 0.22 |
| 11 | Wetted Depth at the end of the irrigation duration, m |
0.18 | 0.22 | 0.25 |
#Wetting radius and depth are extracted from a study by Hamami Moncef et al. (2002) where
they measured both in a silty soil.
From the above table it is clear that the 4 lph emitter even after 2.06 hours of emission will not wet the entire strip. There will be non wet (dry soil) gaps of 15.5 cm at the middle of the lateral between two adjacent emitters as water from each emitter reaches only up to 22 cm of the 37.5 cm radius when the emitters are at 75 cm. Similarly the wet depths also does not join each other leaving dry gaps. The right spacing of the Emitter would be 60 cm in this case. The strip wetting will be complete in the case the first two emitters (1 lph at 30 cm and 2 lph at 40 cm).
The example above is illustrative.
Spacing of lateral and emitter in loam soil
Drip line placement (lateral spacing) and emitter spacing on the lateral in a loam should
suit the dominant fraction of its mix. Thus a Sandy loam would need closer lateral and
dripper spacing compared to a silty or clay loam. That is the main reason of asking for a
soil test before designing the drip system.
Soil testing also indicates the salinity (EC) of the soil and fertility (NPK mostly) levels. These information would help in planning soil amendment (pH correction) and fertilizer planning.
A water test is also essential before designing the drip system. The salt load in the water indicated by the electrical conductivity (EC) helps the expert to plan and schedule the acid injection schedule which is a preventive measure for clogging of the emitters. Emitters do not clog. It is the salt content in the water that causes clogging.
Fig 2. Wetting pattern of soil in well prepared field and cloddy ill prepared fields.
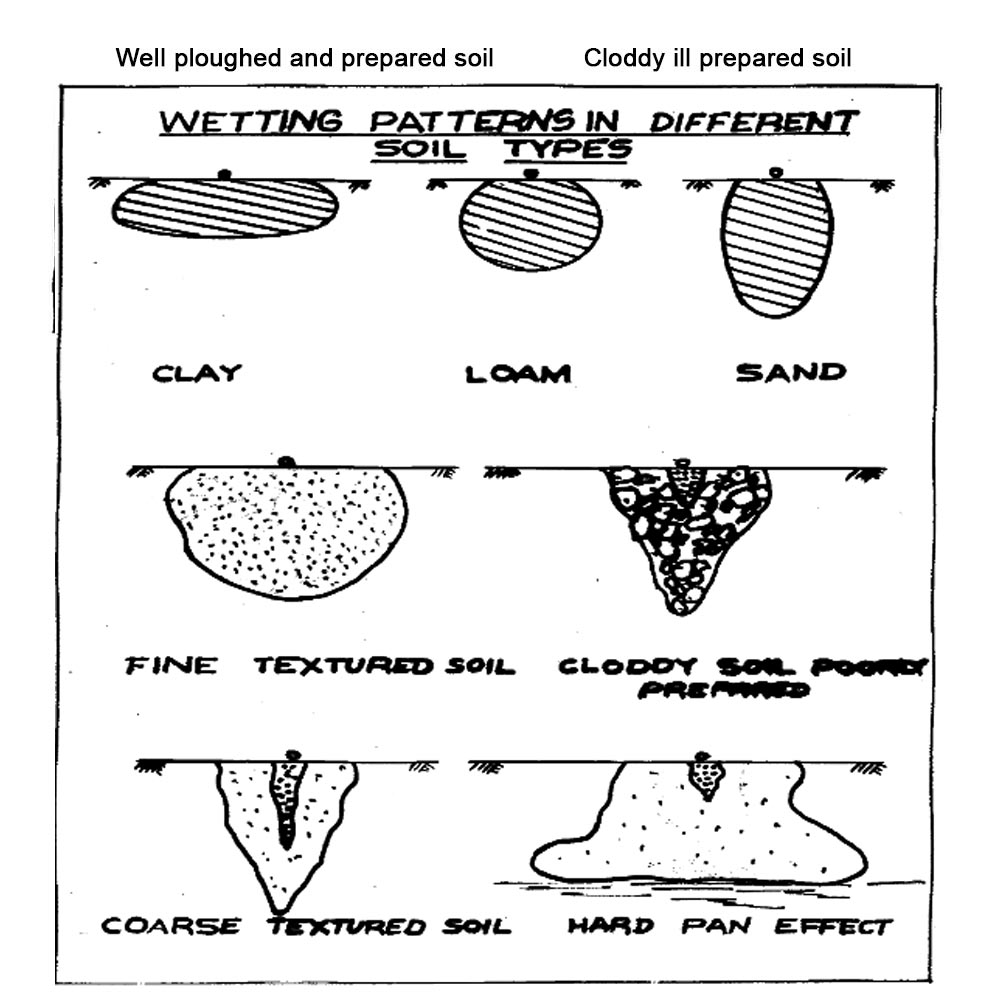
Photo 5. Wetting pattern in a well ploughed loamy texture soil after 1 hr emission from 4 lph emitter.
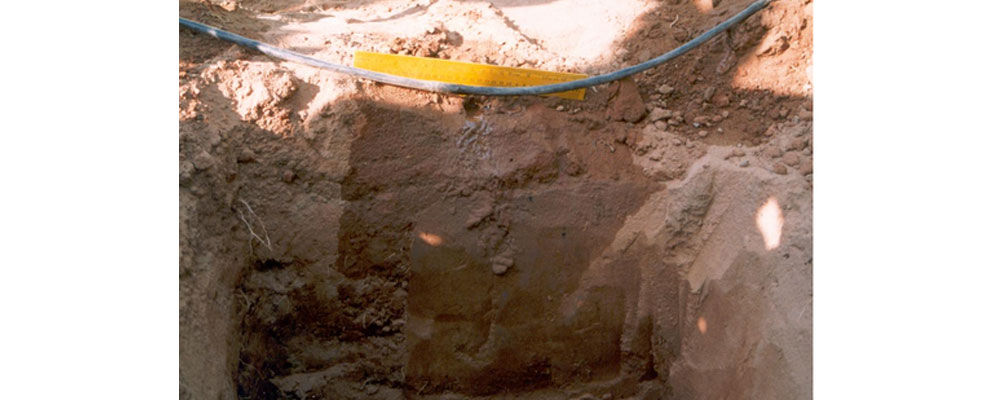
Photo 6. Obstruction of water movement in a soil with hard pan beneath the
top surface. The wetting pattern above is after 1 hr emission by a 4 lph
emitter.
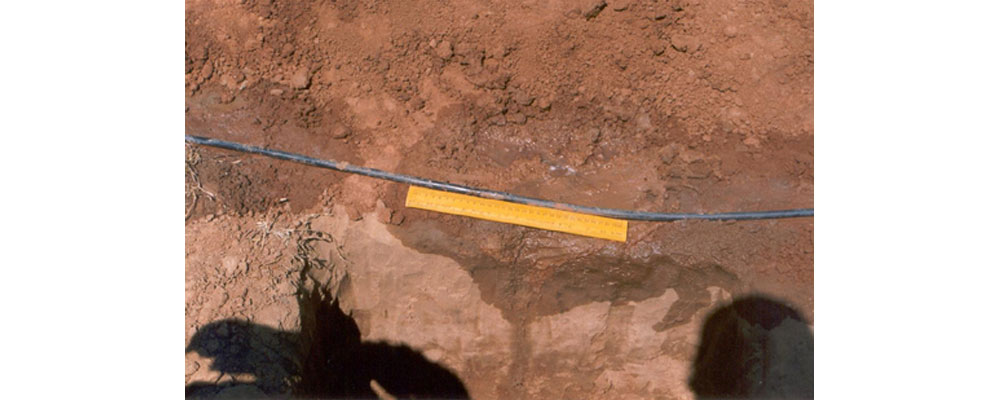
Fig. 3 Wetting pattern vis-à-vis root spread – An ideal case.
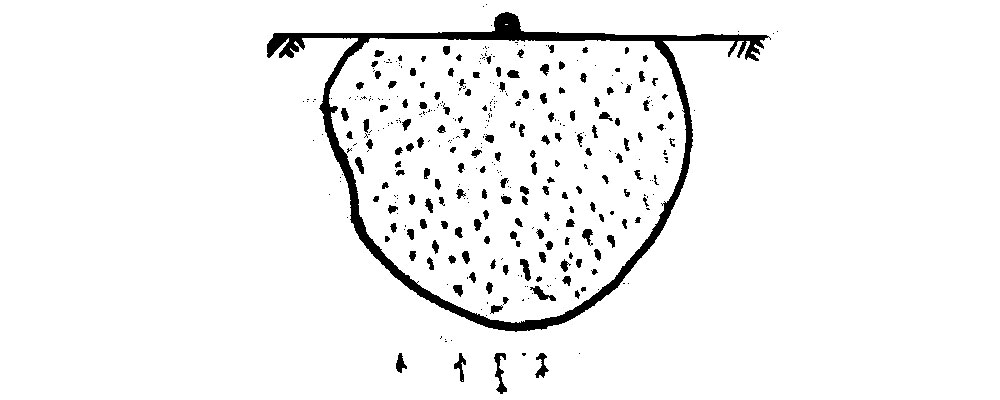
Table 3. Available Water Capacity As Influenced by Soil Textural Class
| Soil Textural Class | Available water capacity mm/m soil depth |
| Clay | 190 |
| Silly clay | 210 |
| Sandy clay | 180 |
| Clay loam | 220 |
| Silly clay loam | 240 |
| Sandy clay loam | 200 |
| Loam | 200 |
| Silt loam | 235 |
| Sandy loam | 185 |
| Loamy sand | 120 |
| Silt | 80 |
| Sand | 80 |
Dent and Young. 1981
Table 4. Moisture Holding Capacities of Different Soils
| Soil Texture | Soil Moisture Content | ||
| Field Capacity % |
Permanent Wilting Pt. % |
Available Moisture % |
|
| Sand | 9 | 2 | 7 |
| Sandy loam (coarse) | 14 | 4 | 10 |
| Sandy Loam | 23 | 9 | 14 |
| Sandy Loam + Organic Matter | 29 | 10 | 19 |
| Loam | 34 | 12 | 22 |
| Clay Loam | 30 | 16 | 14 |
| Clay | 38 | 24 | 14 |
| Well Structured Clay | 50 | 30 | 20 |
Above table gives some guide figures which can be used to illustrate the variations in moisture holding capacities of different soils. Because there are great variations, and because each soil is unique, the value for a particular soil should be determined experimentally.
Plant – Water Relationship
Plant cells and intercellular spaces absorb water by osmosis and by imbibition. By imbibition, water molecules are tied by hydrogen bonds to the cellulose and other water attracting materials in the in plant and materials in the intercellular spaces. By osmosis, water moves from an area of lower salt concentration through a semi-permeable membrane to an area of higher salt concentration.
In biophysical explanation of the process, water moves from areas with higher water potential to areas with lower water potential. Water potential is an algebraic function of the three components: solute potential (parallel to solute concentration), pressure potential, and matric potential. Solute potential is POWER of solutes or salts to suck water due to the presence of salt in the cell solution. Solute potential thus decreases from a negative value to zero as water gets in. Pressure potential is the pressure exerted by the solution on to the walls. It increases from low pressure at low water content to high pressure as water gets in. The matric potential, quantitatively the lowest contributor to the water potential is due to the matrix of material of the plant cells. It also becomes low as water gets in.
(-)Pw = (-) ps + (+) pp + (-) pm).
See the pressure potential ranges from 0 to a positive figure as water gets in.
Solute potential changes from a high negative value to a low negative value (closer to zero) as water gets in
Similarly the matric potential also changes from a high negative to a low negative as water gets in. But overall its value is miniscule compared to those of solute potential and pressure potential.
Because Water potential is the sum of a negative and a positive factors it is always negative (algebraic sum). Theoretically, when plant water potential is 0 the cells are in their turgid satate and no further water can enter the cells/tissue. Because water is continually moving out of the plants through transpiration the zero stage would never stay constant.
When the soil is wet the Soil water potential becomes close to zero (high water quantity and low water potential) and plant water potential is lower (more negative than that of soil) hence water moves from soil to plant. As plant gets water from the soil it moves out of the plant via transpiration and more water enters the plant. This process will continue till soil dries. As transpiration continues despite soil drying progressively at a stage plants will wilt. (Plants have utilized all their water wealth and waiting to get more water from the soil).
Absorption of Water by roots
Under natural conditions, practically all water absorption by rooted plants takes place through the root system. The area of root where the most absorption takes place is the root hair zone. Water diffuses into root hair as a result of the water potential gradient. As long as the water potential of the root cell sap is more negative than that of the soil solution, more water enters the cell. This absorption of water into the root cells occur through root hairs. Root hairs are single cells of the epidermis layer with a large surface area, and each possesses a large vacuole, thus aiding the transport of water from the soil to the cells.
The water normally moves from the soil solution through the semi-permeable cell walls to the inside of the cell. The plant moves the water and nutrients upwards through the xylem tissues of the roots onto the xylem tissues of the stem (the conveyance pipe line in the plants) to the leaves, where it is released to the atmosphere through specialized leaf cells called stomata. In drip irrigation logically the water transpired today will be replaced in the soil the next day and plants continue to transpire and grow. This consistent rate of growth does not happen in flood irrigation as the soil water potential itself will not remain consistent.
Factors Affecting the Absorption of water
There are several factors that affect water absorption by roots. Most important are soil factors, such as temperature, osmotic potential of the soil solution, Aeration and availability of the soil water.
a) Temperature of soil
Soil temperature has a profound influence on rates of water absorption. The low soil temperature reduces water absorption. Water is less viscous at lower temperature, a factor which reduces its mobility. Root growth is inhibited at low temperature.
b) Concentration of the soil solution
Water is absorbed because a water potential gradient exists between the soil solution and cell sap of the interior root cells. The gradient is maintained by the presence solutes (salt ions) in the cell sap.
c) Aeration of soil
There are several reasons for poor aeration having a retarding effect on water absorption. Root growth and metabolism are defiantly retarded under conditions of low oxygen tensions.
This is also a reason why continuous flooding of the soil will not result in much water and mineral absorption.
d) Availability of soil water
The absorption of water by plant becomes more and more difficult as all of the water in the soil in the immediate close area of root system is depleted.
e) Characteristics of the root system affecting water absorption
Since the root systems of different plants sometimes vary a great deal in appearance and extent of soil penetration there is no doubt that their water absorbing capacity also differs. Some root system penetrate deep into the soil, while others form a dense network of branch roots that do not penetrate deep but cover a large area of soil at a shallow depth.
Besides providing anchorage in the grow medium (soil) roots also conduct and store water and nutrients in general. Anchorage is normally provided by the older portions of the root system and absorption by the root hairs and tender portion.
Table 5. Moisture Extraction Depths for Crops#
| Shallow 60 cm | Moderately Deep Rooted 90 cm | Deep Rooted 120 cm | Very Deep Rooted 180 cm |
| Cauliflower | Carrots | Cotton | (Grown on very deep, well-drained soils) |
| Cabbage | French bean | Tomato | Alfalfa |
| Rice | Garden Pea | Watermelon | Citrus |
| Wheat | Chilli | Maize | Apple |
| Onion | Muskmelon | Sugar Beet | Grapevine |
| Potato | Chickpea | Coffee | |
| Lettuce | Sugarcane | ||
| Tea | Sunflower | ||
| Banana | Pigeon pea |
#When grown on very deep and well-drained soils
Jain irrigation has strong agronomy and engineering expertise and drip irrigation designs and implementation are planned using the depth of this expertise. In the absence of lack of application of these expert knowledge drip irrigation will not produce the desired results- Higher yield and quality with lower consumption of water, fertilizer and power.
social media