Welcome to Jain Irrigation Systems Ltd.
Blog at Jains

Blog at Jains - DIFFERENTIAL APPLICATION OF FERTIGATION LEVELS TO ENHANCE CANE YIELD TO MAXIMUM OF SUGARCANE CV.CO 86032 UNDER SUBSURFACE DRIP IRRIGATION
Abstract: Average sugarcane yield ranges from 61-63 t/ha in India. Using drip and fertigation technologies for irrigation and fertilizer application some farmers are producing very high yields of cane in the range of 250 t/ha and above. These yields are the result of very high doses of fertilizer application and adoption of drip irrigation. But are we getting high fertilizer use efficiencies in such high yield situations? Are these high input levels economically viable? In the present study two high level fertilizer treatments (T1 and T2) were compared with the local recommended dose of NP and K (T3) in fertigation through sub surface drip irrigation system. Yields were higher in both T1 and T2 compared to that in T3. However, the very high fertilizer dose used in T2 did not enhance the yield proportional to the input. Fertilizer use efficiency (FUE) was found lower in T1 and T2 compared to that in T3. Excessive application of fertilizer did not result in economic returns.
Citation: Soman P., et al., (2018) Differential Application of Fertigation levels to Enhance Cane yield to Maximum of Sugarcane Cv.CO 86032 under Subsurface Drip
Irrigation. International Journal of Agriculture Sciences, ISSN: 0975-3710 & E-ISSN: 0975-9107, Volume 10, Issue 11, pp.- 7104-7107.
Copyright: Copyright©2018 Soman P., et al., This is an open-access article distributed under the terms of the Creative Commons Attribution License, which permits
unrestricted use, distribution and reproduction in any medium, provided the original author and source are credited.
Introduction
Sugarcane, an important cash crop in India, is the major source of sugar. It occupies second position in the country in its economic and industrial importance, next only to cotton and textile industry. It is cultivated over an area of 5.14 million ha [1]. More than 12.34 million workers are engaged in sugarcane industry, a poverty reducing crop for rural population of India. Sugarcane industry contributes significantly to the socio-economic development of rural population and its share 0.69 % of GDP (2014-15) from 6.26 million sugarcane- holdings. The national average for cane yield is about 61-63 t/ha [2]. Sugarcane being C4 plant, is an efficient solar energy harvester. It responds to bright sun light, higher temperatures and nutrients, provided soil moisture is optimum and soil physical, chemical and biological fertilities are normal. Moore, 1989 [3] had placed the theoretical maximum sugarcane yield at 470 t/ha/year. Hapse [4] had assumed a photosynthetic efficiency of 3.6 % and calculated a theoretical potential of cane yield equivalent to 339 t/ha. The highest yield achieved by prize winning farmers is around 255 t/ha, and the highest productivity achieved at Research station is 167 t/ha and while the then existing average productivity 78.64 t/ha [5]. In Tamil Nadu, India where the present studies were carried out, the potential productivity for sugarcane is 193.7 t/ha, while the productivity recorded in the field is 100.8 t/ha and the yield gap 92.9 t/ha (47.96 %). It is an uphill task for common farmers to achieve productivity levels of Research station and that of the prize-winning farmers [4]. Such high yields are hardly achieved, though individual farmers have reported yields close to this figure [6]. Zende [7] reported on the soil nutrient removal by sugarcane; i.e., 1.2 kg N , 0.46 kg P and 1.44 kg of K per ton of cane produced. According to Sonny Viator et al (8) a 100 t/ha sugarcane crop removes from soil 100:60:225 kg NPK /ha. An average crop of 100 t/ha removes 208, 53, 280, 30, 3.4, 1.2, 0.6, and 0.2 kg of N, P, K, S, Fe, Mn, and Cu respectively from the soil [9]. These variations are probably due to the differences in experiments and estimation. Fertigation is more efficient means of applying nutrients [10,11]; nutrients ratio can be adjusted according to the needs of the crop and development stages [12]. Fertigation ensures that the nutrients are applied precisely at the zone of most intensive root activity, according to the specific requirements of sugarcane crop resulting in higher fertilizer use efficiency. They found that the yield obtained due to application of 75 % and 100 % recommended dose of fertilizers was on par, indicating 25 % saving in fertilizers. Daffolla [13] found that the injection of fertilizers during the entire irrigation period produced the best distribution uniformity of added urea, three-fourth distribution of plant nutrients more evenly throughout the wetted root zone resulting in increased nutrients’ availability and uptake, contributing to higher crop growth rates and cane yields. Zande, [7] reported that soil nutrients resources will not be able to sustain intensive cropping of sugarcane and recommended use of fertilizers in balanced proportion and adequate amounts and is inevitable to attain the potential production. The fertilizer recommendations for sugarcane in Tamil Nadu N: P: K 325: 138: 162 kg/ha [14]. Maximum N is absorbed within 90 days after planting; delayed N application results in late tiller production and prolongation of the maturity phase with accumulation of reducing sugars and poor juice quality. The use efficiency of nitrogenous fertilizers ranges from 30-40%. Nitrogen losses are as (NO3) nitrate leaching, ammonia volatilization from soil and crop tops and denitrification as nitrogen oxides [14]. It is also reported that fertigation of N and K to sugarcane enhances their efficiency; while saving the cost of fertilizers [15]. The economic benefit of applying water soluble fertilizer to sugarcane was found significant. Sezhian and Balasubramanian [16] compared the fertilizer-use efficiency (FUE) in different irrigation methods and found that FUE was maximum under drip-fertigation, 95 % (N), 45 % (P), and 80 % (K) as compared to 30-50%, 20 % and 50 % FUE for N, P and K respectively under flow irrigation and direct soil application of fertilizers. Ningaraju et al [17] showed that fertigation once in two days has given on par results, on the quality parameters viz; Brix 20.46 % with lesser reducing sugar 2.83 %, recorded significantly higher cane yield and sugar, 281.4 t and 38.38 t/ha respectively. Similar, results were also observed under fertilizer levels, application of 125 % recommended dose of fertilizers (RDF) through subsurface fertigation recorded higher quality parameters but cane, sugar yield was higher in 150 % RDF-283.1 and 39.11 t/ha. Mahesh et al [18] concluded that sub-surface drip-fertigation with water soluble fertilizers in sugarcane (Chip bud seedlings planting) had resulted in higher cane yield, water saving and water use efficiency. The fertigation trial on sugarcane Cv. CO 86032 was carried out at Jain Irrigation systems ltd (JISL) R & D farms, Udumalpet, Tamil Nadu with the main objective of investigating whether higher doses of fertilizers over and above the recommended dose is economical and whether it results in higher yields and returns, commensurate with the extra expenses incurred toward the cost of fertilizers and to recommend to the sugarcane growers, the optimum doses for maximum yields in sugarcane.
Materials and Methods
The experiment was conducted at the Research and Development Farms, Jain Irrigation Systems (JISL), Udumalpet, Tamil Nadu during 2013 and 2014. Soil of the experimental site is red loam with organic carbon 0.55 %, available N 158 kg/ha, P 100.4 kg/ha and K 334 kg/ha [Table-1] The experiment was laid out in randomized block design (RBD) with three treatments consisting of three fertigation levels and replicated thrice.
Table-1 Soil nutrient status (NPK) of the plots before planting and after harvesting two crops.

The land was prepared to fine tilth, plot size 20 m X 20 m, 3 Treatments X 3 Replicates; total 9 plots in an area of 3600 m2 (0.36 ha) was laid out. Each fertigation treatment in each replication occupied 405 m2. (i.e., a total area 1214 m2 for a fertigation level in 3 replications together). Drip system installed at lateral to lateral (16 mm) at 1.5 m; dripper spacing at 50 cm, discharge 4 lph; Laterals placed 10 cm below the soil surface. The placement of drip lateral and the seed cane sets are described in detail in (19). Viable, healthy two budded sets of Cv. CO 86032 were planted at the time of laying the drip lines at the specified depth. Setts placed 15 cm below the soil surface and 15 cm away from the lateral on either side of it. Herbicide Atrazine (50% WP) at 1 kg ai/ha was sprayed two days after planting as pre-emergence weedicide and two manual weeding were done on 45th and 90th days after planting in all treatments. The fertilizer levels for T1, used by one of the famer who produced 250 t/ha and T2 estimated level for a yield target of 500 t/ha using the fertilizer removals reported by Zende (7). The fertilizer level for T3 treatment is the recommended fertilizer dose for Tamil nadu state, India (followed by all sugarcane farmers) which is taken as a control level in this study [Table-2]. Fertigation schedule (% quantity of each fertilizer applied and their duration) and actual water soluble fertilizer used is given in [Tables-3] and [Tables-4].
Table-2 Fertilizer levels for Fertigation
T1- 525: 195: 430 kg/ha NPK (a farmer tested this level in his farm and
harvested 250 t/ha in Maharashtra)
T2- 1050 : 320: 505 kg/ha NPK (estimated for achieving 500 t/ha using the NPK
removal to produce 1 t cane as published and adjusting values with the actual
soil and organic matter NPK contents of the field )
T3- 325: 138: 162 kg/ha NPK recommended for Tamil Nadu (control).
Table-3 Common % split adopted for scheduling fertigation in all three treatments#
in Plant and Ratoon crops$.

#the actual quantum of fertilizer will be different in each Treatment, but the % split of each
nutrient remains the same in all three.
$In ratoon, the fertilizer quantity for each treatment is increased uniformly by 25%; the %
split for fertigation is same as above.
**The P fertilizer was fertigated only till 85 days (31-85 days) in all treatment levels.
N as urea (46 % N); P as phosphoric acid (52 % P); and K as Muriate of potash (white ) (60% K), all water soluble forms were used for fertigation. Farmyard manure was applied at 25 t/ha, two weeks before planting the crop. For the ratoon crop the fertilizer levels were increased by 25 % in all treatments. In addition to the NPK, Zinc and Iron sulphates at rates of 25 kg/ha each and Magnesium sulphate at 50 kg/ha were applied to the crop in all treatments and both in plant and ratoon crops. Iron sulphate was added to the base soil at land preparation, while Zn and Mg sulphates were fertigated on 30th day. Intercultural operations and the management practices of the crop followed were according to standard practices. Harvest: The canes from each replicate of the three treatments harvested at the age of 305 days after planting, and the following growth and yield parameters were determined. The same observations were recorded for Ratoon crop (date of ratooning 25, January,2014). The stem height (m) from the soil surface to the top most visible node was recorded in a random sample of 10 plants from each replicate of the three treatments. Weight in kg of single cane at harvest, number of mill-able canes counted per running 5 meter , for each replicate of the three treatments and the mean derived for individual treatments. Yield per ha was estimated from the plot yields measured in each replication of the 3 fertigation treatments. The same observations were repeated in the Ratoon crop. The data obtained for plant crop and ratoon crop are subjected to statistical analysis. N,P, and K (kg) used for producing one ton of cane (Fertilizer-use-efficiency, FUE) is calculated. Cost of urea, phosphoric acid and muriate of potash used for each treatment (plant crop) were calculated (INR) per ha basis, percentage change in fertilizer cost, percent change in yield, ratio of output to input (fertilizer input and yield output) were calculated for each treatment .
Results and Discussion
Biometric observations were recorded at harvest of plant crop and ratoon on millable cane (number per 5 running meter length), cane height (m), single cane weight ( kg) and yield (ton/ha). Mean values of the three replicates of each treatment of the plant crop and ratoon are given in Table 5. Yield and millable cane number differed significantly among the three levels of fertigation in Plant crop. The highest level of fertilizer (T2) resulted in 223 millable stems in 5 m. It is significantly high compared to both T1 and T3 (control). Yield in T2, 303.2 t/ha was significantly higher than the yields in T1 and T3 in plant crop. The yield recorded both in plant and ratoon crop in T3 (control) is far higher than the yields recorded for that recommended dose of fertilizers. The same trend in respect of yield and yield components was reflected in the ratoon crop as well. Cane yield was maximum in T2 (243.4 t/ha) followed by T1 (221.7 t/ha) and minimum in T 3 (202.2 t/ha). In Table 6 the yield of cane in ton per unit N,K and P and N,K and P nutrients in kg used to produce one ton of canes are depicted. The cost of urea, phosphoric acid and potash used and the total, cane price realized for each treatment were estimated. Output: input ratio was then calculated (only fertilizer cost taken for calculation), ratio of output to input are given in Table 5. Single cane weight and cane height did not differ significantly. In the ratoon, though the trend remained the same, the millable cane numbers did not differ significantly. As for the yields are concerned, T2 once again remained superior, albeit by a smaller yield difference from the other two treatments. However, the N,P and K fertilizer use efficiency was maximum in treatment 3 and the N,K and P unit nutrients used to produce one ton cane and the cost of fertilizers was also minimum under this treatment. There is a very evident wastage of nutrients in T2 where it was the estimated quantum for 500 t/ha. Though this treatment produced highest yield figures in both plant and ratoon crops, the data in Table 4 clearly show that more nutrients applied do not necessarily result in higher output in terms of the response to nutrients.
Table-6 Nutrient use efficiencies for N K and P estimated using the total applied
nutrient and cane yield (plant crop yield)

The yield increment in T2 was only 8.66 % over that in T1 and 21.5 % over that in T3.
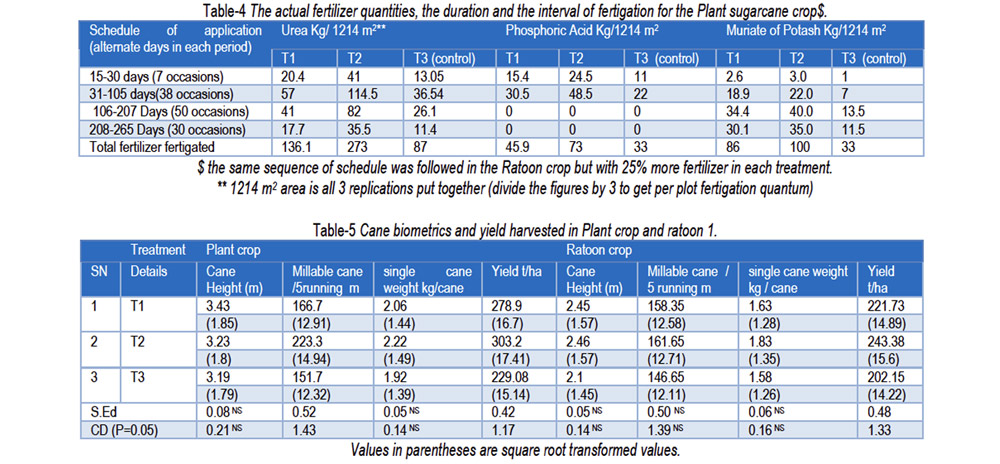
The change in fertilizer cost was 154 % and change in yield was 32.4 % in T2. The incremental income was INR 143260/ha in T2 against the fertilizer input of INR 30,359/ha. While in T1 the change in fertilizer cost was 53% as against a change in yield of 21.5%.The incremental income accrued was INR 98800/ha and the ratio of output to input 9.36. Fertilizer use efficiency was maximum 1.41 kg N, 0.6 kg P and 0.71 kg K were used to produce one t of cane. It can be inferred that the application of fertilizers at the highest level in T 2 had not resulted in any significantly higher yield and the meagre increase in yield of 8.66 % over that in T1 was not commensurate with the extra quantity of fertilizers applied and the cost of fertilizers incurred. Thus it may also be inferred that the application of 525: 195: 430 kg of N,P,K /ha seems to be the optimum level for getting economically viable maximum yield. The high yields in all the three treatments (compared to average yield obtained in conventional cane cultivation are due to the crop’s response to sub-surface fertigation, which is responsible for the high fertilizer-use-efficiency as reported by several workers [13,15,17,18,20 and 21]. The high yield obtained in T1 in the present experiment had surpassed the prize winning farmer’s yield (6), but close to potential yield per ha and the output to input ratio is close to double (9.36) that of T2 (4.71) reiterating the fact, that excessive use of fertilizers did not result in higher economic returns, and can also be detrimental to soil health in the long term. But as found from Table 1 the soil in all three fertilizer levels (T1,T2, and T3) were found to be exhausted of nutrients. It is pertinent to carry out more detailed study of fate of nutrients in the soil in such high production systems before making inferences and fertilizer recommendations.
Application of research: With modern input management technologies like drip irrigation and fertigation, farmers begin to enhance cane yields by increasing fertilizer doses. The study looks at this issue and using differential fertigation quantities try to see matching economic returns are possible when fertilizer inputs are increased. This type of information will help while updating fertilizer recommendations for sugarcane.
Research Category: Fertigation management; Sugarcane yield maximization.
Acknowledgement / Funding: Author thankful to Jain Irrigation Systems ltd., Tirupur, Udumalpet, 642154, Tamil Nadu, India. A special appreciation of the support given by Dr Amol Chaudhary, Research farm, Udumalpet, Tamil Nadu.
Principal Investigator: Dr P Soman
Research institute/ Firm: Jain Irrigation Systems ltd., Tirupur, Udumalpet, 642154,
Tamil Nadu, India
Research Project Name: Fertigation studies and standardization in Sugarcane
Author contribution: All authors contributed equally
Author Statement: All authors read and approved the manuscript.
Conflict of interest: There is none declared.
Ethical Approval: The article does not contain any studies with human or animal participation performed by any of the authors.
References
[1] Anon (2016) Agriculture situation in India.
agristat.http://www.des.kar.nic.in.
[2] Rajesh Kumar S.S. Hasan and Pathak A.D. (2016) Indian J. of
Sugarcane Technology, 31,2.
[3] Moore (1989) www.fapesp.br.pdf.bioen.Moore
[4] Hapse D.G. (2006) In Cane development workshop on recent
developments in sugarcane production technologies with special
reference to the precision farming. Vasant Dada Sugar Institute, Pune,
13-14, Sept. 2006.
[5] Co-Operative Sugar Press news (2006) Published by National
Federation of Cooperative Sugar Factories Ltd.
[6] Solomon, S (2011) Sugar Technology, 13 (4) 255-265.
[7] Zande G.K. (1990) In (Rao, P.N. Ed.) Recent Advances in Sugarcane.
KCP ltd. Viyyuru, A.P., .99-200.
[8] Sonny Viator H.P., Richard Jhonson and Brenda Tubana (2014. Mid -
South Fertility, 1,1.
[9] Bhaskaran A. and Palanisami C. (2016) In Handbook of Sugarcane,
Sugarcane Breeding Institute, Coimbatore, 97-110.
[10] Rasker B.S. and Bhoi P.G. (2001) Indian Sugar, 200150 (11), 801-
810.
[11] Mahendran S., Stephen J., Arun A.C., Prabhakaran P. and Raja R.
(2005) In Proc. Natl. Seminar –Relevance of micro irrigation in
sugarcane, 9-10,Feb. 2005. Vasant Dada Sugarcane institute, Pune,
170-178.
[12] NAAS (2009) Policy paper,42. NAAS, New Delhi, India.
[13] Daffolla Alla Mohd. Abdel Wahab (2014) Agril. Sci., 5 (11), 945-957.
[14] TNAU (Tamil Nadu Agricultural University) (2015).
agritech:tnau.ac.in.sugarcrops.
[15] Tang Q.Z., Tian X., Zhu S.B. and Deng Y.D. (2006) Sugar Technology
8 (4) 303-305.
[16] Sezhian N. and Balasubramanian A. (2008) Sugar Journal. 39th
Annual Convention of South Indian SSTA 65-76.
[17] Ningaraju K., Shankaralingappa, Nagaraju, Yogananda S.B.,
Thimmegauda M.V. (2017) International J. of Pure and Applied
Bioscience., 5 (3) 735- 739.
[18] Mahesh R., Ashokraja N. and Archana H.A. (2016) World Irrigation
Forum 6-8, Nov 2016.
[19] Jain Irrigation systems Ltd. (2010) Technical Brochure on subsurface
drip installation for sugarcane.
[20] Gurusamy A.P., Mahendran P., Krishnasamy S. and Babu R. (2013)
Intl. J of Chem. Environmental and Biol.sci.,1 (2), 387-390.
[21] Sathyaraj and Sathyapriya (2017) Intl. J. of Current Microbiology and
Applied science, 6 s(11), 3674-3684.
Source :https://www.bioinfopublication.org/jouarchive.php?opt=&jouid=BPJ0000217
social media